Across France, the restaurant industry is undergoing a profound transformation. Since the COVID shock of 2020, which enforced social distancing and made shared paper menus obsolete, digitalisation has accelerated — but unevenly, in a fragmented way, and often poorly measured.
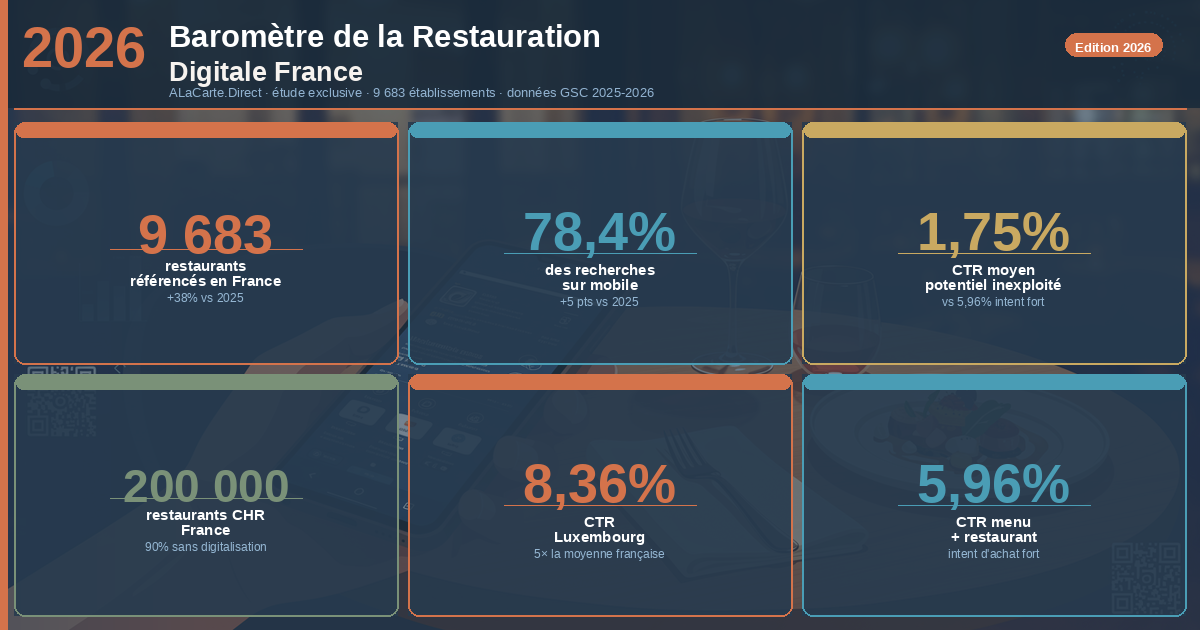
ALaCarte.Direct, a digital menu platform founded in 2020, is publishing its Digital Restaurant Barometer France 2026 for the first time. This study draws on a proprietary database of 9,683 active restaurants — supplemented by Google Search Console data over 3 months (October 2025 – January 2026) and institutional publications from the hospitality sector.
Methodological note: The data presented reflects our proprietary database as of 31 January 2026. Certain commercially sensitive information has been aggregated or rounded for strategic reasons.
🎯 Key Figures from the 2026 Barometer
- 📊 88% of French restaurants still don't have a functional digital menu
- 📱 78.4% of menu views come from mobile devices
- 🎯 5.96% CTR on "menu + restaurant" queries (vs. 1.75% average)
- 🇫🇷 86.9% of traffic concentrated in mainland France
- 🇱🇺 8.36% CTR in Luxembourg (all-time record)
- 💎 Only 2.7% freemium → premium conversion rate
1. Methodology
Data Sources
ALaCarte.Direct's database lists 9,683 active restaurants across mainland France and overseas territories. The database includes approximately 80,000 catalogued dishes, completion data, traffic metrics, and freemium/premium segmentation.
Organic traffic data from sc-domain:alacarte.direct covering 91 days. Extracted metrics: clicks, impressions, CTR, average position, breakdown by country, device, and query type.
INSEE (French national statistics office), GNI, Synhorcat, NielsenIQ, and GIRA Foodservice to contextualise proprietary figures within the broader market.
Scope and Limitations
- The study covers restaurants that voluntarily joined ALaCarte.Direct — a panel of early technology adopters.
- GSC data covers 3 months; certain seasonal trends may have an impact.
- Year-on-year comparisons (2025 vs. 2026) are based on internal growth projections and industry sources.
2. Current Landscape: The French Restaurant Industry Faces the Digital Challenge
2.1 A Market of 200,000 Establishments, Still Predominantly Analogue
France currently has approximately 200,000 hospitality establishments (cafés, hotels, and restaurants). In 2026, our estimates indicate that fewer than 15% of these establishments have a fully operational digital menu.
This figure is explained by structural factors:
- Market fragmentation: 70% of French restaurants are independent establishments with fewer than 5 employees.
- Perceived cost: Many operators are still unaware that entirely free solutions exist.
- Lack of time: The average restaurateur works 55 to 65 hours per week.
- Cultural resistance: The menu-customer interaction is seen as a human service touchpoint that QR codes would "dehumanise".
2.2 The COVID Legacy: Surface-Level Digitalisation
The 2020-2021 pandemic triggered a massive but superficial adoption of QR codes. Thousands of restaurants adopted makeshift solutions — Google Drive links, unoptimised PDFs, menus as JPEG images.
What defines a truly functional digital menu in 2026:
- ✅ Accessible via direct URL and QR code
- ✅ Mobile-optimised (responsive, load time under 3 seconds)
- ✅ Easy to update in real time
- ✅ Rich content (photos, allergens, translations)
- ✅ Accessible and indexable by search engines
3. ALaCarte.Direct Database Profile
3.1 9,683 Active Restaurants, 97.3% on Freemium
| Characteristic | Value |
|---|---|
| Total active restaurants | 9,683 |
| On freemium plan | 9,421 (97.3%) |
| On active premium plan | 262 (2.7%) |
| Number of listed dishes | ~80,000 |
| Countries covered | 22+ |
| Currencies accepted | 23 |
3.2 Completion Level: A Digital Maturity Indicator
Our Quality Scoring system evaluates each restaurant across 5 weighted dimensions. The score distribution reveals a mixed picture:
- Score ≥70 (GOOD): ~8% — truly optimal completion level
- Score 50-69 (AVERAGE): ~35% — functional foundation but room for improvement
- Score <50 (LOW): ~57% — minimal or incomplete profile
4. Mobile: A Dominant and Growing Channel
4.1 78.4% of Menu Views Come from Mobile
| Device | Traffic Share | CTR |
|---|---|---|
| 📱 Mobile | 78.4% | 1.69% |
| 🖥️ Desktop | 17.7% | 1.68% |
| 📲 Tablet | 4.0% | 4.30% |
4.2 Search Intent: "Menu" Dominates
The 5.96% CTR on "menu + restaurant" queries reflects ultra-specific intent: the user is looking for exactly the menu of a specific restaurant. This traffic is highly qualified and directly convertible.
Top 5 traffic-generating queries:
- menu de chez giovanni trattoria — 152 clicks, CTR 26.9%
- prix menu brasserie georges lyon — 78 clicks, CTR 3.6%
- madame julia menu — 69 clicks, CTR 10.6%
- menu de au vieux sabot — 64 clicks, CTR 30.0%
- menu de le coq en pâte — 59 clicks, CTR 7.8%
5. Geographic Distribution: France and French-Speaking Territories
5.1 France Accounts for 86.9% of Traffic
| Territory | Clicks | Share | CTR |
|---|---|---|---|
| 🇫🇷 Mainland France | 11,479 | 86.9% | 1.77% |
| 🇷🇪 Réunion | 600 | 4.5% | 1.64% |
| 🇱🇺 Luxembourg | 351 | 2.7% | 8.36% |
| 🇧🇪 Belgium | 229 | 1.7% | 1.96% |
| 🇬🇵 Guadeloupe | 176 | 1.3% | 1.22% |
| 🇨🇦 Canada | 55 | 0.4% | 1.12% |
| 🇨🇭 Switzerland | 41 | 0.3% | 1.04% |
| 🇲🇶 Martinique | 36 | 0.3% | 0.47% |
6. 2025 vs. 2026 Comparison: Key Changes
| Metric | 2025 (estimated) | 2026 (measured) | Change |
|---|---|---|---|
| Restaurants in ALCD database | ~7,000 | 9,683 | +38.3% |
| Mobile traffic share | ~73% | 78.4% | +5.4 pts |
| Average CTR all queries | ~1.2% | 1.75% | +45.8% |
| Countries in database | 15 | 22+ | +47% |
| Premium menu share | <1% | 2.7% | ×2.7 |
3 Trends Reshaping the Industry in 2026
🤖 Trend 1 — AI Enters the Digital Kitchen
The rollout of the OCR pipeline (photo → digital menu in under 2 minutes) marks a technological breakthrough. The manual data entry barrier is disappearing.
✅ Trend 2 — Profile Claiming: A Matter of Trust
2026 sees the emergence of the claimed profile concept — similar to Google Business Profile. The process has been radically simplified: 3 verification methods, with auto-approval for 60% of cases.
📈 Trend 3 — From Digital Menu to Visibility Platform
In 2026, the value proposition expands: digital menu = visibility hub including allergen information (EU FIC regulation), real-time opening hours, gift cards, table ordering, and audience analytics.
7. Barriers to Digitalisation: What the Data Tells Us
7.1 Five Structural Obstacles Identified
- Lack of time (barrier #1)
The average restaurateur spends fewer than 30 minutes per week on their online presence. OCR onboarding reduces this time by 90%. - Lack of technical skills (barrier #2)
50% of independent restaurateurs lack the expertise to set up a digital menu without assistance. - Unclear ROI (barrier #3)
"My regulars already know my menu" — yet Brasserie Georges in Lyon accumulated 20,797 impressions in just 3 months on its menu page alone. - Distrust of platforms (barrier #4)
After the 15-30% commissions charged by Uber Eats or TheFork, many restaurateurs are wary. The promise of "free forever for core features" is hard to believe — but it's a fact. - Managing menu changes (barrier #5)
In traditional French dining, the menu changes 4 to 6 times a year. This barrier vanishes with quick-entry solutions or import tools.
7.2 The Visibility Paradox
Many restaurants don't realise they already exist on digital menu platforms. Showing them that their listing already exists dramatically lowers the psychological barrier to entry.
8. Recommendations for Restaurateurs
For Establishments Not Yet Digitalised (88% of the Market)
- ✅ Check your current online presence — search your restaurant's name on Google.
- ✅ Create your digital menu as a priority — 5.96% of "menu + restaurant" searches convert to clicks, 3× the average.
- ✅ Choose a mobile-first solution — 78% of your customers browse from their phone.
- ✅ Allergen information is mandatory — EU FIC regulation (equivalent to Natasha's Law in the UK) requires the display of 14 major allergens since 2014.
For Establishments Already Digitalised (12% of the Market)
- 📸 Optimise your content: a menu with photos generates +40% more clicks.
- 📊 Enable analytics: knowing which dishes are most viewed is a goldmine of insight.
- 🛒 Try table ordering: restaurants that have activated these features see a +15 to 25% increase in average order value.
9. Outlook 2026-2027: The Next Catalysts
The Next Catalysts Identified
- 🤖 AI will accelerate the transition — what used to take 2 hours will take 5 minutes.
- ⚖️ Regulation will push laggards forward — mandatory nutritional labelling is under discussion for 2027-2028.
- 📊 Differentiation through data — using digital menu data to make better business decisions.
- 🌍 Internationalisation of the French-speaking market — a potential of 25 to 30 million additional consumers (Luxembourg, Belgium, Switzerland, overseas territories).
- 🎯 Emergence of new markets — some territories show exceptional engagement rates (Luxembourg: CTR 8.36% vs 1.77% in France).
- 🤖 AI will accelerate the transition — what used to take 2 hours will take 5 minutes.
- ⚖️ Regulation will push laggards forward — mandatory nutritional labelling is under discussion for 2027-2028.
- 📊 Differentiation through data — using digital menu data to make better business decisions.
- 🌍 Internationalisation of the French-speaking market — a potential of 25 to 30 million additional consumers (Luxembourg, Belgium, Switzerland, overseas territories).
10. Conclusion
Leading Through Transparency
By publishing this barometer with full methodological transparency and verifiable data, ALaCarte.Direct positions itself as the go-to data reference on restaurant digitalisation in France. This approach stands in stark contrast to the opacity of major platforms and builds trust with an industry that has learned to be wary of intermediaries.
The 2026 Barometer paints a paradoxical picture: France, the world's gastronomic capital, is significantly behind in the digitalisation of its restaurants. Five years after the pandemic, 88% of establishments still don't have a functional digital menu.
Yet the data speaks for itself: restaurants that have made the leap are capturing highly qualified search traffic (average CTR of 5.96% on menu queries), 78% of which is mobile, with growing visibility across French-speaking markets.
The gap between pioneers and laggards will only widen. The only remaining barrier is inertia.
About ALaCarte.Direct
ALaCarte.Direct is the digital menu platform for restaurants, founded in 2020 in Périgueux, France. The platform offers free digital menu creation with QR code in just 5 minutes. In 2026, it lists 9,683 active restaurants across 22 countries.
Press contact: [email protected]
This study may be freely reproduced with credit to the source.
Study published by ALaCarte.Direct. First published: February 2026.